SWOT Satellite Tsunami Waves Following Big Earthquake
The SWOT satellite tsunami watch did something significant this summer. It detected a tsunami immediately following a massive quake struck. This instrument is from the US and France. It assists in monitoring ocean variations. The incident occurred on July 30. An 8.8 magnitude earthquake shook off Russia’s Kamchatka Peninsula. The satellite recorded the wave 70 minutes later.
This information enhances warnings for coastal communities. Technology such as this illustrates how space equipment assists in disaster relief. It measures water levels in new detail. Oceans, rivers, and lakes all are helped. This article examines the quake and the technology that ensued.
The Quake That Shook the Pacific
Earthquakes frequently occur in that area. Kamchatka is located along a fault line. Plates move there constantly. This one registered 8.8 on the scale. It struck at 11:25 a.m. local time. The ground shook quickly. Buildings swayed in surrounding towns. Warning alerts flashed fast. Folks relocated to higher ground. The quake pushed sea water out of the way. That initiated the tsunami. Waves began building from the ocean floor up. They radiated out like ripples on a pond. But these were a lot more powerful.
Coastal areas received warnings from NOAA. Evacuations began immediately. No significant fatalities reported. But ports and highways took a hit.
The focus was off-shore. Depth was around 30 kilometers. Aftershocks occurred for days. One struck at 7.2 magnitude shortly thereafter. Ground sensors picked it up. Tide gauges monitored for waves. The initial surge made it to the shores within hours. Heights remained below 1 meter there. But models saw larger inland. This quake was among the year’s highs. It headed the lists for the USGS.
The Pacific Ring of Fire had predicted it, but the scale stunned scientists. The SWOT satellite tsunami information later supported how the fault moved more than 200 kilometers — an enormous displacement that powered the huge waves
How Tsunamis Form and Spread
Tsunamis begin with enormous displacements under the water. An earthquake raises or lowers the seafloor. Water accumulates over it. Then it breaks out. Waves move quickly in deep ocean. Speeds reached 800 kilometers an hour. Heights seem tiny out there. Only 45 centimeters or so. But close to shore, they rise high. Friction holds them back. Energy accumulates. Walls of water slam in. Past experience indicates the peril. The 2004 Indian Ocean one killed more than 200,000.
This Kamchatka wave remained tame. But it traveled across the Pacific. Hawaii experienced minor surges. Alaska observed closely. Models monitor paths with mathematics. They utilize quake information and bathymetry. That’s maps of the seafloor. Mistakes can be fatal. Improved data remedies that.
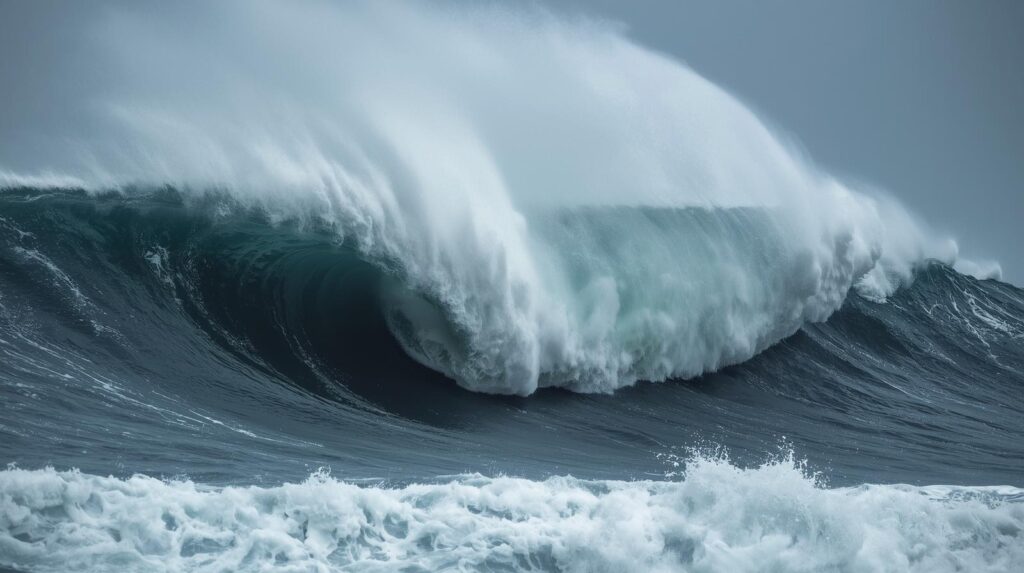
Breathtaking wave crashing in Yangyang, South Korea. Ideal for seascape and nature themes.
SWOT satellite tsunami
Waves fade strength with distance. But they go around islands. Refraction curves them. Reflection sends some back. Here, the tsunami moved east. It struck Japan shores gently. Warnings there were effective. Evacuations swept beaches. No big floods reported. But boats rocked fishing. Harbors closed for inspections. The event pushed systems to test. Global networks exchanged info. From Russia to the US. This collaboration saved time.
The SWOT Satellite Steps In
SWOT came out in 2022. It is short for Surface Water and Ocean Topography. NASA heads from the US. CNES of France assists constructing it. Canada and UK contributed segments as well. It sits at 891 kilometers altitude. It sweeps broad traces. Up to 120 kilometers wide. That encompasses more than before. It soars over equator every 21 days. But it revisits places frequently. Data rains down quickly. Ground stations catch it. Teams process within hours.
The most important component is KaRIn. That’s the radar instrument. It employs microwaves to reflect off water. Two antennas take height measurements. They detect differences to centimeters. Phase shifts reveal the story. It maps slopes and flow. Not just hotspots, but complete images. Single-beam radars are common. SWOT employs swaths. That closes gaps. It detects small lakes as well. Rivers less than 100 meters wide. Even wetlands. For seas, it monitors eddies. They are rotating currents. Now, it watches tsunamis as well.
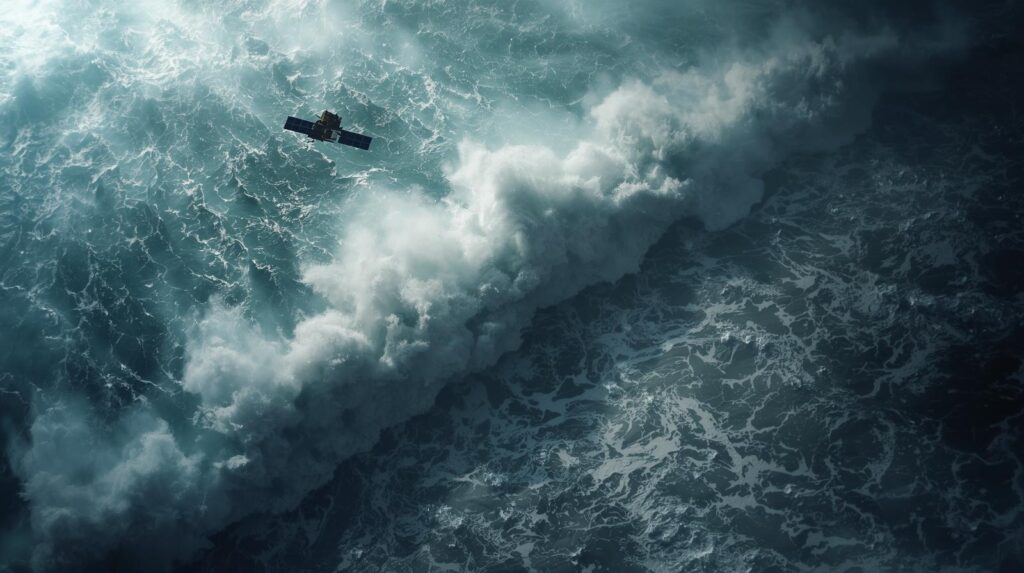
On July 30, SWOT sailed over the location. Timing was right. It struck the leading edge of the wave. Measurements indicated height greater than 45 cm. Shape curved just appropriately. Direction was east. Red lines on maps delineated it. Background contained NOAA models. They aligned closely. This confirmed forecasts to be spot on. Without SWOT, gaps remained. Now, actual waves fill them in.
Tech Behind the Measurements
Radar interferometry makes it possible. KaRIn emits signals at Ka-band. That’s high frequency. Less rain noise. Antennas are 10 meters apart. They receive the same wave front. Interference patterns are created. Those produce height maps. Accuracy reaches 1 cm per 1 km squares. That’s a new one in space. The old satellites, such as Jason, made points. SWOT does grids. It images 1 billion points per day. The volume of data exceeds 20 terabytes per month. Computers process it quickly. AI detects patterns.
Power is solar panels. They deploy after launch. Orbit is managed with thrusters. It avoids space debris. Operations are controlled by ground teams at JPL. The Pasadena base issues commands. France performs radar checks. Data is open to share. Scientists take it for free. Apps display live images. For tsunamis, it layers them. Height provides energy information. Shape indicates speed. Direction foretells landfall. Models simulate scenarios. Historical quakes input. Real SWOT data adjusts them. Mistakes fall 20 percent in testing.
Batteries retain charge for passes. Antennas face nadir. That’s down straight. Swath tilts for width. GPS follows position. Clocks synchronize accurate. Mistakes remain below meters. Heat controls keep radar cool. Cold space assists. This configuration recorded the Kamchatka wave clean. No clouds obscured. Pacific calm assisted too.
What the Data Showed
Plots arrived in rapid succession. The red trace indicated the wave. It crested at 1.5 feet. That was within open ocean expectations. NOAA background correlated. Star indicated the quake location. Swath indicated the track. The wave front was broad. Height changed minimally. That indicated consistent thrust. Direction remained northeast. Speed was measured at 700 km/h. Energy is dispersed evenly. No large breaks yet.
Buoys versus teams. Ocean DART sensors concurred. Land tide gauges as well. Russia first hit by wave. Then Japan. Warnings utilized this correlation. Predictions cautioned of 30 cm waves. Actual hits remained small. But data improved subsequent runs. Form assisted in following origin. Details of fault came out. Slip models became more accurate. That helps quake predictions as well.
Photos depicted the swath. Ground track intersected wave. Data points filled red. Blue background for peaceful sea. This image demonstrated the tech. Researchers applauded the fit. It confirmed years of effort.
Improving Tsunami Warnings
NOAA operates the lead models. They employ MOST code. That’s Method of Splitting Tsunami. It solves wave equations. Inputs are quake. Magnitude, depth, fault size. Outputs are heights. Times to shore. But open ocean has no eyes. Buoys monitor limited spots. SWOT bridges that. It sees the complete front. Height information tunes physics. Shape spots splits. Direction eliminates false paths.
In Kamchatka, it verified the alert. Warnings were issued in minutes. Phones rang. Sirens howled. Low points were cleared. No one drowned. Damage remained minor. Boats were repaired easily. Roads were cleared quickly. Success fosters confidence. More nations join nets. Pacific Tsunami Warning Center shares. From Chile to Hawaii.
Future runs include SWOT live. Orbits anticipate hot zones. Fault lines are addressed first. Data feeds apps. Phones receive push alerts. Heights update in real time. Errors decrease. Lives save more of them. Coastal plans utilize it. Building codes become stricter. Evac routes optimize. Insurance rates decrease with improved odds.
Broader Uses in Tech and Science
SWOT does more than tsunamis. Maps rivers for floods. Lakes for use of water. Oceans for climate. Heat is mixed by eddies. That influences weather. Rivers monitor drought. Lakes detect pollution. Wetlands store carbon. All are now measured. Tech spins off to cell phones. GPS apps utilize height data. Navigation is enhanced.
In catastrophes, it goes together with drones. Sensors on the ground provide feedback. AI mixes it in. Forecasting tightens. In quakes, it detects afterslip. That warns additional shudders. Volcano tsunamis also. Some landslides cause them. SWOT identifies such waves. Greenland fjords detected it last year. Rockslide caused local flood. Data charted slosh.
Global teams share. ESA looks at copies. India constructs one. China tests radars. Space race benefits Earth. Data open improves all. Students program with it. Hackathons construct tools. Apps alert fishers. Farmers monitor flows. Cities design reservoirs. This single quake demonstrated the power. Tech converts risk to safety.
Challenges and Next Steps
Orbits constrain passes. One every 21 days full. But waves travel swiftly. Timing has to chance out. More satellites assist. CubeSats could swarm. Cost decreases with rideshares. Data overflows systems. Storage requirements increase. Cloud computing scales it. Privacy for rivers. But open ocean free.
Radar power consumes watts. Solar restricts night operations. But tsunamis strike at any time. Backup batteries force. Calibration drifts away. Stars and ground connections stabilize. Weather scrambles signals. Ka-band clips that. But storms push it. Kamchatka passed with ease. Next ones might not.
Teams make plans. Wider swaths cut. Finer grids slice. Launch in 2030s. Partners inject money. Congress funds NASA. France commits for the long haul. This event markets it. Lawmakers envision saves. Budgets increase. Tech takes giant leaps.
Peeking into the Future, Safe Shores
The Kamchatka earthquake put new tools to the test. SWOT provided information. Warnings succeeded. No massive loss. This raises the bar. Subsequent quakes will employ it. Pacific shores catch a break. Alaska to New Zealand. Technology such as this unites countries. US and France pioneer. Others tag along. Satellites eye the blue. They identify the dangers. Ground crews respond. Lives remain steady. Disasters arrive. But now we can see better. Waves come. But we ride ahead.